
Derbyshire Property Market Report – October 2026
Derbyshire property values remain higher than a year ago, but today’s market is becoming more selective. Buyers have more choice, mortgage costs are influencing budgets, and sellers need the right strategy. Our October report explains what this means for sellers, buyers and landlords across Derby, Alfreton and the wider county as autumn unfolds.
Prices are holding up in Derby and Alfreton, but buyers have more choice
Published: 23 October 2026
September to October: what changed?
Compared with September’s report, October presents a slightly more cautious picture. Official annual price growth across the Derbyshire county council area eased from 5.0% to 2.8%, while Amber Valley, covering Alfreton, moved from 4.8% to 2.7%. Derby remained steady at 2.7%.
Meanwhile, asking-price sentiment improved slightly, but East Midlands homes are now taking around 74 days to find a buyer, compared with 70 days last month, and the average two-year fixed mortgage rate has risen from 5.29% to 5.55%. Local House Price Index figures are provisional and can be revised, so this does not mean individual homes suddenly lost value; it suggests that price growth is moderating while affordability and increased buyer choice are making the market more competitive.
Derbyshire house prices are still higher than they were a year ago.
The latest official figures show annual growth of 2.8% across the Derbyshire county council area, with both Derby and Amber Valley recording growth of 2.7%. As Alfreton sits within Amber Valley, that is the most relevant official measure for the Alfreton property market.
However, the figures describing today’s market are less straightforward.
Buyers have more properties to choose from. Mortgage rates have increased. Fewer people are contacting estate agents, and homes are taking longer to find a buyer.
That does not mean the Derbyshire property market is falling apart. Nor does the positive Land Registry data mean that every property is increasing in value.
It means we have a resilient but increasingly selective market.
To explain why, we use our established three-layer model:
1️⃣ Official UK House Price Index trends, based on completed sales.
2️⃣ HM Land Registry evidence of transactions that have completed and been registered.
3️⃣ Current market momentum from Rightmove, Zoopla, RICS and the Bank of England.
Each layer measures a different stage of the property market. Looking at them together gives us a much more useful picture than relying on one headline.

Layer one: Official property values remain positive across much of Derbyshire
The latest UK House Price Index covers August 2026 and was published by HM Land Registry on 21 October 2026.
The average UK property value was £273,000, an increase of 0.9% over twelve months. England recorded more modest growth of 0.4%, while the average East Midlands property value reached £241,955, up 0.5% annually.
The local Derbyshire figures were generally stronger.
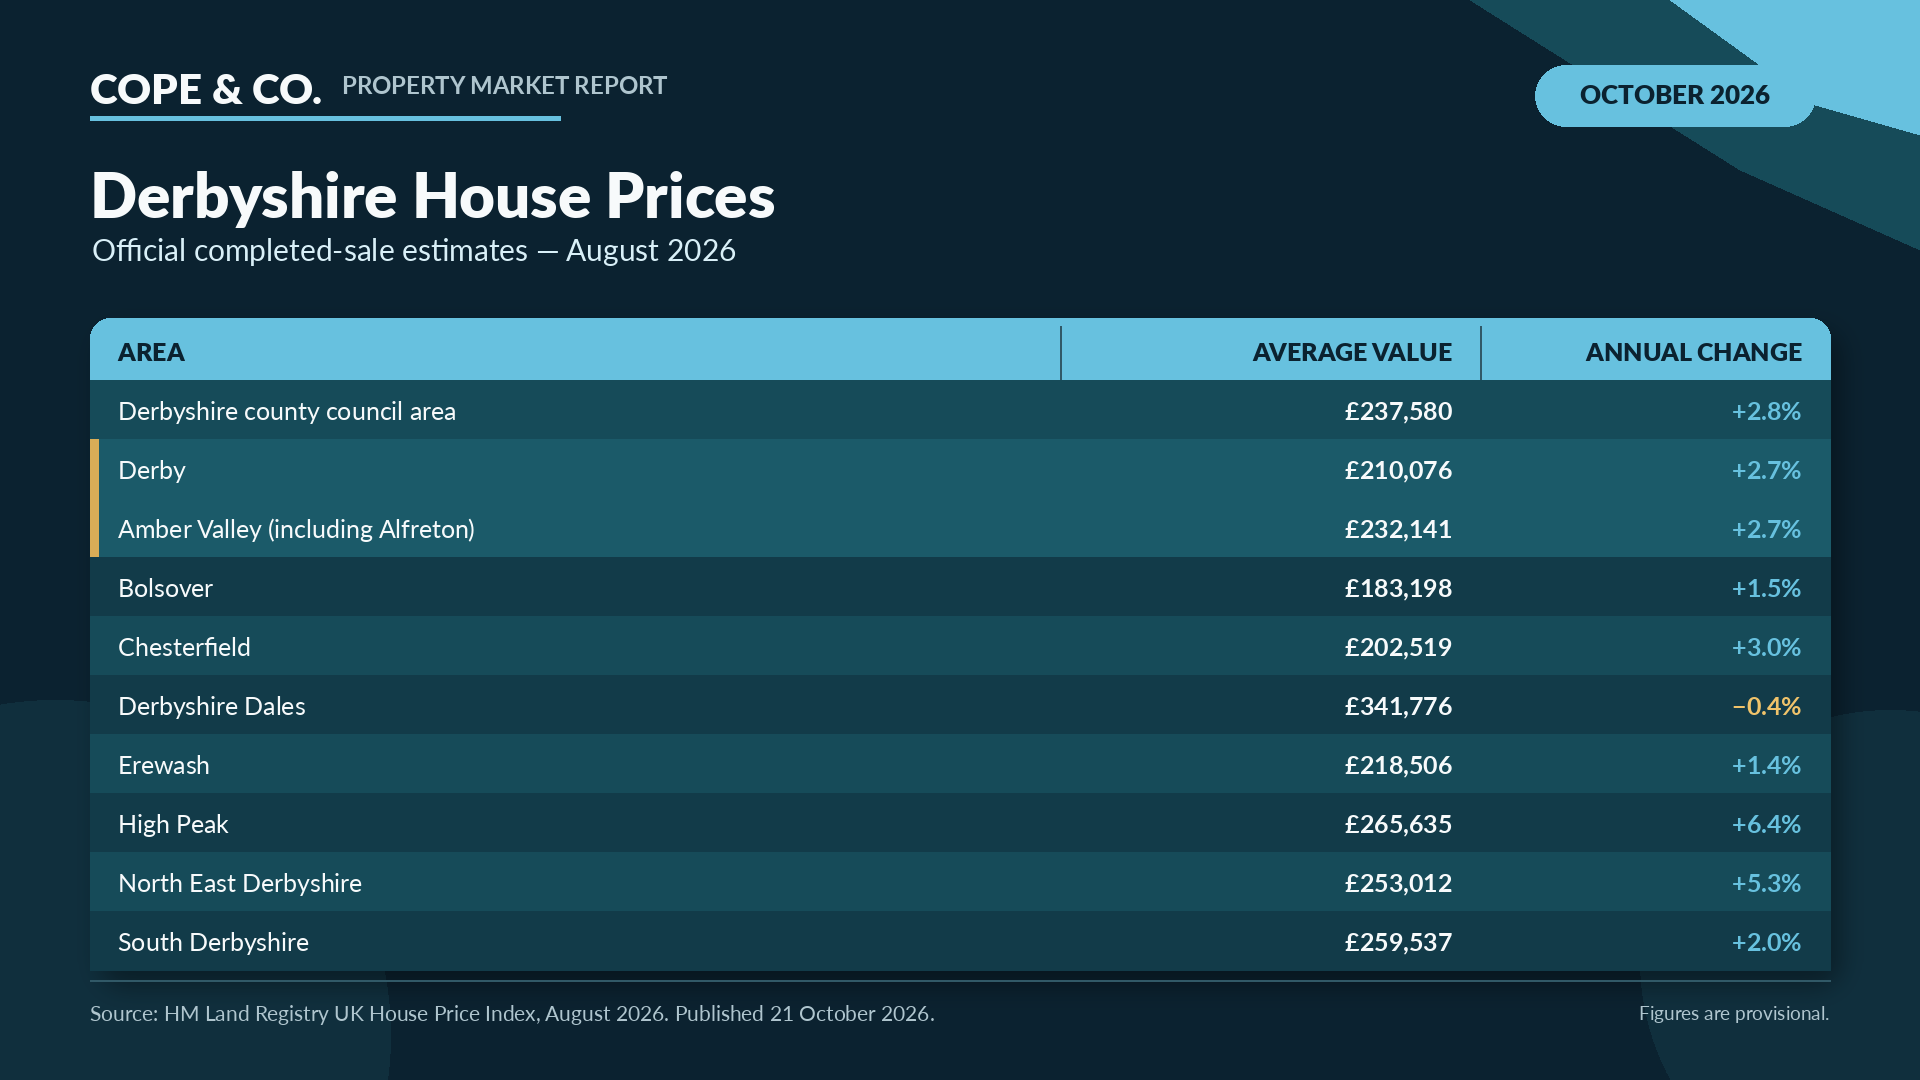
The Derbyshire figure refers to the county council area. Derby is a separate unitary authority and is reported separately. GOV.UK
What does this tell us?
On the latest official estimates, much of Derbyshire has performed better than both England and the East Midlands as a whole.
For the Derby property market, the average value is approximately £210,000, with annual growth of 2.7%.
For homeowners in Alfreton and the wider Amber Valley area, the official average is approximately £232,000, also 2.7% higher than a year ago.
There is, however, considerable variation within the county. High Peak and North East Derbyshire recorded much stronger annual growth, while Derbyshire Dales was slightly lower than a year earlier.
This is a useful reminder that there is no single Derbyshire property market. Performance varies by location, price range, property type and condition.
HM Land Registry also warns that local estimates are based on fewer transactions than national figures. They can therefore be more volatile and should be considered alongside longer-term trends rather than relying too heavily on one month.
Houses are generally performing better than flats
Across the UK, semi-detached homes increased by 2.1% over the year and terraced homes by 1.8%. Detached homes rose by a more modest 0.7%, while flats and maisonettes fell by 1.6%. That difference matters locally.
A three-bedroom semi-detached house in Derby or Alfreton may be experiencing a stronger market than a city-centre apartment, even though both sit within the same headline figures.
An area-wide average is useful market context. It is not a valuation of an individual property.

Layer two: What does the completed-sale evidence show?
The second layer looks at properties that have actually completed and been registered with HM Land Registry. This is different from an asking price, a viewing, an accepted offer or a Sold STC board.
The latest local sales-volume figures in the August UK HPI release cover June 2026. HM Land Registry currently records the following completed transactions:
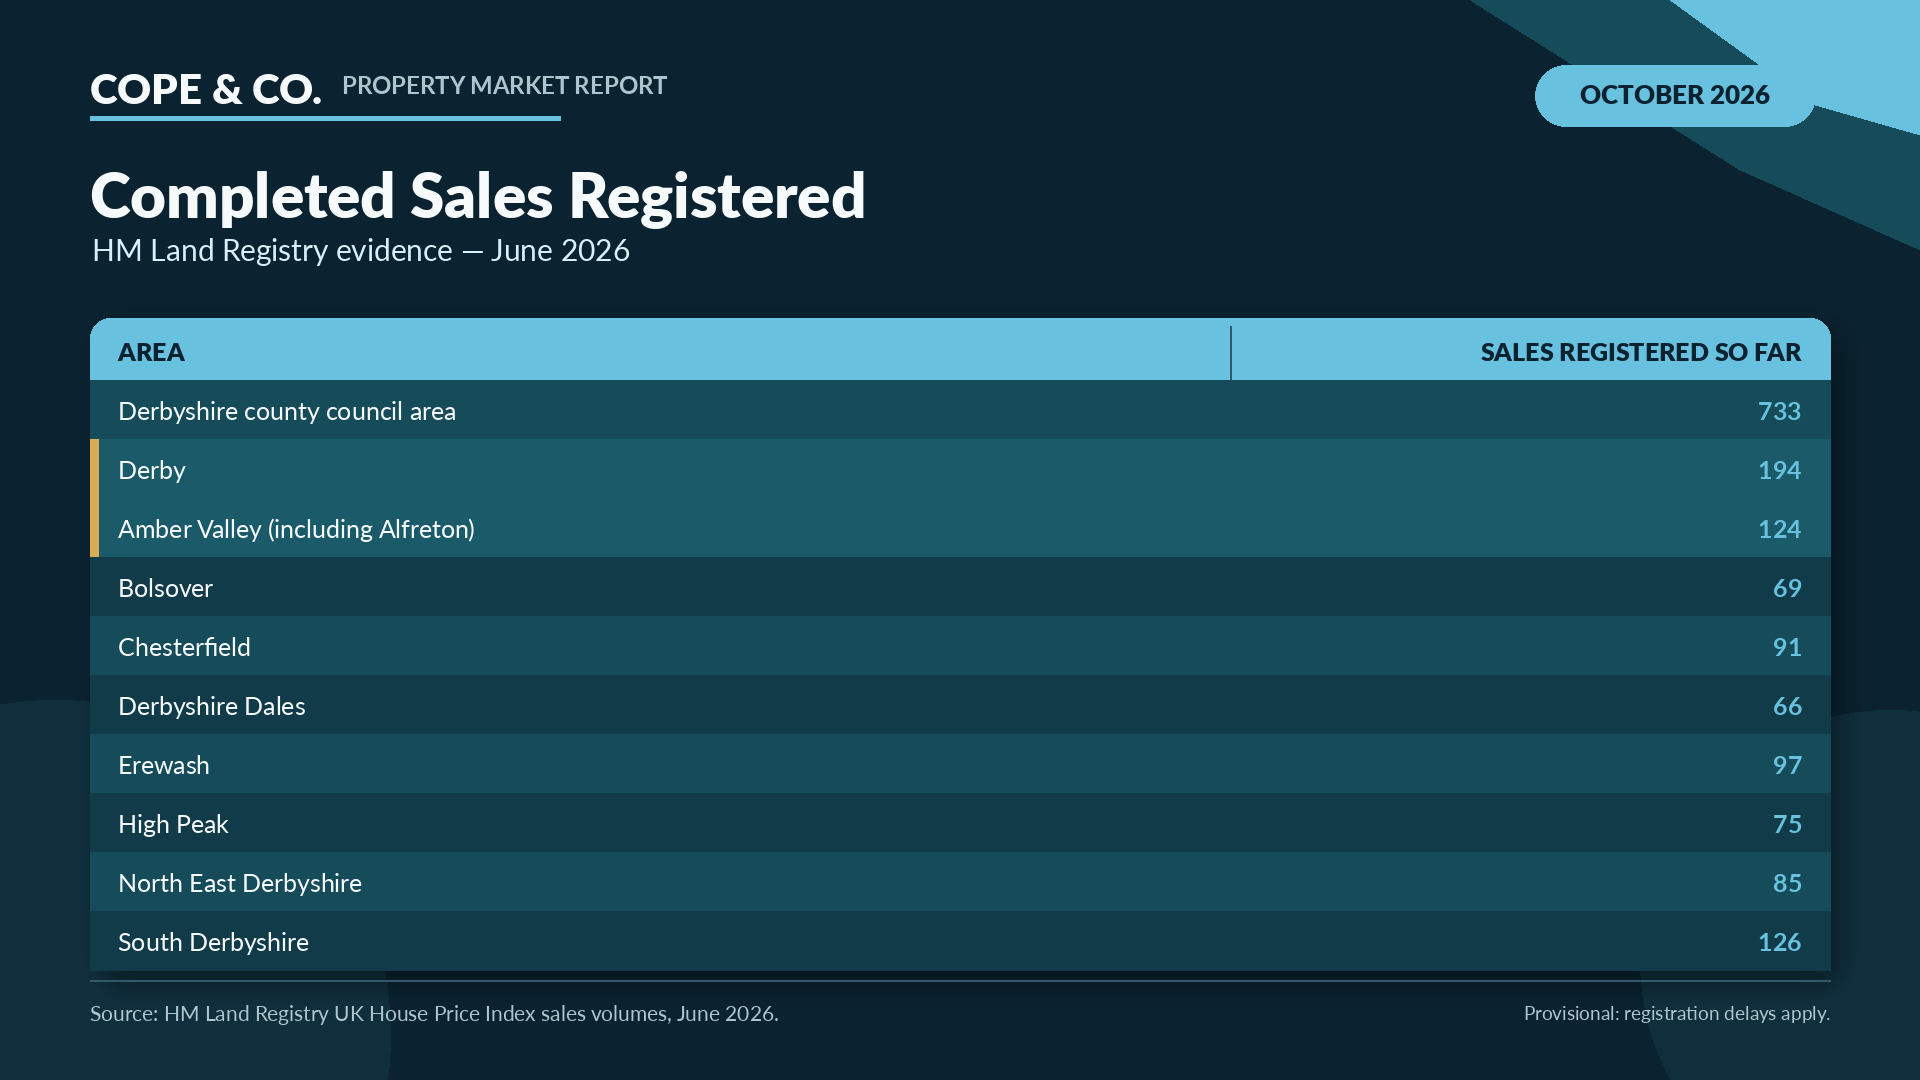
These figures confirm that properties are continuing to progress all the way through to completion across Derbyshire.
However, there is a major qualification.
The current figures are not final transaction totals
There is normally a delay between a sale completing and the transaction being registered. HM Land Registry says this commonly takes between two weeks and two months, but it can take longer.
It also states clearly that sales-volume data for the most recent twelve months is provisional and should not be used to infer trends in market activity. More transactions will be added to the June figures as registrations are processed.
That means it would be misleading to take the current June 2026 figure, compare it directly with the now more complete June 2025 total, and describe the difference as a confirmed collapse in sales.
The latest standalone Price Paid Data release covers August 2026. HM Land Registry gives the same warning there: the initial release for a month should not be used in isolation because earlier transaction records will continue to be added.
A more complete national cross-check
HMRC’s separate transaction statistics are more complete for recent periods because property-tax returns are normally submitted shortly after completion.
HMRC recorded an estimated 95,220 seasonally adjusted UK residential transactions in August 2026. That was 2% lower than August 2025 and 1% lower than July 2026.
That supports a more balanced conclusion; The market is still functioning and substantial numbers of sales are completing, but overall transaction activity is slightly softer than it was a year ago.
It does not support the suggestion that buyers have disappeared or that the market has stopped moving.

Layer three: What is happening in the market now?
The official House Price Index tells us what happened when sales completed, usually several months after the properties first came to market.
For a more immediate picture, we need to look at new listings, buyer enquiries, available stock and recently agreed sales. This is where the October report becomes more challenging for sellers.
Asking prices have risen, but remain virtually unchanged over the year
Rightmove reports that the average price of a newly listed property increased by 1% in October, reaching £371,015. However, that figure remains 0.1% lower than a year ago. In other words, October’s monthly increase has not translated into meaningful annual asking-price growth.
For the East Midlands, the average new seller asking price is £290,907. That is 0.4% higher than the previous month and only 0.3% higher than a year ago. The average East Midlands property is taking approximately 74 days to find a buyer. That is the period from first advertising the property to accepting an offer, not the additional time required to exchange contracts and complete.
Buyers have more properties to choose from
Rightmove’s live-market data shows:
🔸 Sales being agreed are 8% lower than a year ago.
🔸 New potential buyers contacting agents are 9% lower.
🔸 New listings are 3% higher.
🔸 The number of available properties is at its highest level for this time of year since 2014.
Zoopla’s September report reaches a similar conclusion. It recorded 5% more homes for sale than a year earlier, while the number of sales agreed was 9% lower. Zoopla describes buyers as cautious and particularly sensitive to price, rather than absent from the market.
The September RICS survey also reported subdued buyer enquiries and agreed sales, while the supply of new properties coming to the market edged upwards. RICS respondents expect the market to remain broadly stable over the next twelve months, but with continued near-term pressure.
Mortgage affordability is restricting budgets
Rightmove’s average two-year fixed mortgage rate increased to 5.55%, from 5.29% the previous month. It estimates that the typical monthly payment on a new mortgage has increased by approximately £250 since February.
Bank of England figures provide further evidence of weaker borrowing momentum. There were 54,900 net mortgage approvals for house purchases in August, down from 55,900 in July and below the previous six-month average of approximately 60,100. The effective interest rate on newly drawn mortgages also increased from 4.45% to 4.60%.
Bank Rate remained at 3.75% following September’s Monetary Policy Committee meeting, although three of its nine members voted for an increase to 4%. Bank of England
The plain-English interpretation!
There are still motivated buyers in the market, but they are:
🔸 working with tighter affordability limits;
🔸 comparing more competing properties;
🔸 taking longer to make decisions; and
🔸 less willing to overlook an unrealistic asking price.
That makes this a price-sensitive market, rather than a market in which nothing is selling.

What does the October market mean for sellers?
Positive Land Registry figures are not permission to overprice
The official figures are encouraging for Derbyshire homeowners. Average completed values in Derby and Amber Valley remain higher than they were a year ago.
But those transactions reflect offers that may have been agreed several months earlier.
A seller launching today is competing in a market with more available stock, fewer new buyer enquiries and higher mortgage costs.That means the correct question is not simply; “How much have Derbyshire house prices increased?” It's “What other properties can a buyer choose instead of mine?”
The launch price is becoming increasingly important
We bang on about this all the time.. because it's so true! Buyers tend to pay the most attention to a property when it first appears online.
If it launches at a credible price, presents well and compares favourably with the alternatives, it can still attract strong interest and competitive offers. If it starts too high, the risk is that the initial attention produces few viewings. By the time the price is reduced, the property may already have been available for several weeks and buyers may assume there is a problem.
Reducing an inflated asking price later is not always the same as pricing correctly at the beginning.
Presentation must support the price
Professional photography, accurate floorplans and strong descriptions remain important, but sellers should also consider the physical presentation of the home.
When buyers have several comparable properties to choose from, small differences matter:
✅ condition and cleanliness;
✅ quality of decoration;
✅ lighting and photography;
✅ kerb appeal;
✅ room presentation; and
✅ whether any obvious repairs have been addressed.
None of those things changes the location or size of a property. Together, however, they can influence whether a buyer books a viewing and how confident they feel when making an offer.
Allow for a realistic timescale
The East Midlands average of 74 days to find a buyer is only the first part of the process. Conveyancing, mortgage work, searches and chains then need to be completed.
Sellers with a particular moving date should therefore start planning early, prepare the relevant paperwork and consider instructing a conveyancer before a buyer is found.
Our advice to Derbyshire sellers
This remains a perfectly workable market for sellers who are realistic, prepared and properly advised.
It is less forgiving for anyone who assumes that a positive annual house-price figure guarantees an inflated sale price.

What does the October market mean for buyers?
You have more choice and potentially more negotiating room
Higher stock levels mean buyers can compare more properties before making a decision. Some sellers will be willing to negotiate, particularly where a property has been available for an extended period, needs work or has already had a sale fall through. But greater choice does not mean every seller is desperate.
Correctly priced homes in popular areas of Derby, Alfreton and the wider Derbyshire market can still attract several interested buyers.
Understand the individual property
A blanket assumption that every property should sell for a fixed percentage below the asking price is unlikely to work. A sensible offer should take account of:
🔎 comparable completed sales;
🔎 the condition of the property;
🔎 how long it has been advertised;
🔎 whether the price has already been reduced;
🔎 competition from other buyers; and
🔎 the seller’s position and timescale.
The strongest negotiation is based on evidence, not simply on a national newspaper headline.
Get financially prepared before making an offer
With mortgage rates changing and affordability calculations tightening, buyers should establish a realistic budget before becoming emotionally committed to a property.
That means speaking to a mortgage adviser, understanding likely monthly repayments and obtaining an agreement in principle where appropriate.
A buyer who has organised their finances, instructed a solicitor and resolved any sale in their own chain may also be more attractive to a seller than someone offering slightly more money but with a less certain position.
Our advice to buyers
The current market offers more choice than buyers have enjoyed for some time.
Use that choice carefully, but do not allow the search for a theoretical bargain to cost you the right long-term home.

What does the October market mean for landlords?
The rental market continues to tell a stronger story than the sales market. The latest ONS figures cover September 2026.
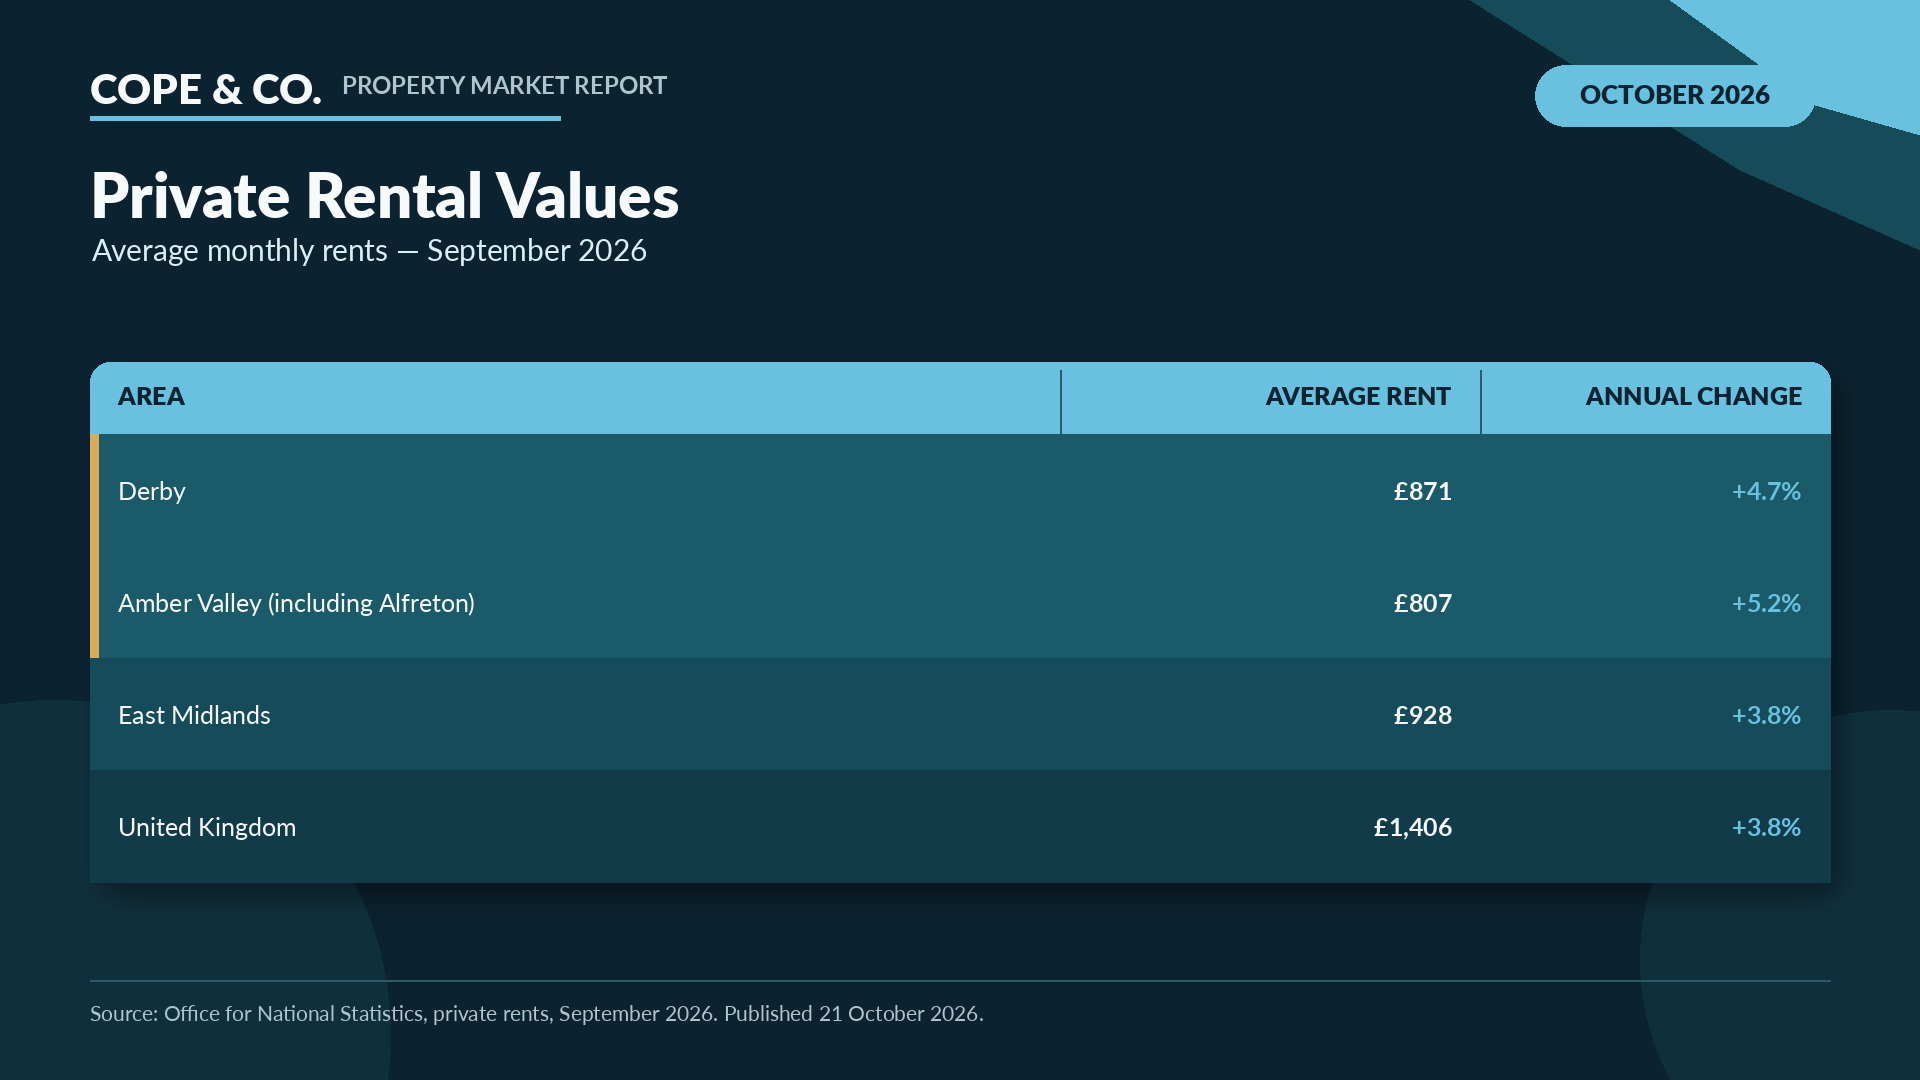
For the Alfreton rental market, Amber Valley is again the most relevant official local-authority measure. Rental growth in both Derby and Amber Valley is currently running ahead of local annual house-price growth.
That is encouraging for existing landlords, but it does not automatically mean that every investment is becoming more profitable.
It is what you keep that matters!
A landlord’s actual return is influenced by more than the headline rent. The full calculation should include:
🏠 mortgage interest;
🏠 management costs;
🏠 repairs and planned maintenance;
🏠 insurance;
🏠 compliance expenditure;
🏠 void periods;
🏠 arrears risk; and
🏠 future capital expenditure.
A £50 monthly rent increase adds £600 to annual gross income. An unexpected boiler replacement, prolonged void or expensive mortgage product can remove several years of that gain.
Demand remains strong, but supply is constrained
The RICS September survey reported a further increase in tenant demand, while new landlord instructions remained in negative territory. Surveyors continued to expect rents to rise over the following three months.
That supports the wider picture of resilient tenant demand, but landlords should still avoid assuming that every property will achieve any advertised rent.
Location, condition, energy efficiency, property type and presentation all influence demand.
What should existing landlords do?
Existing landlords should review each property individually. That includes checking:
🔲 whether the rent remains appropriate;
🔲 whether the tenant is likely to remain;
🔲 upcoming maintenance and compliance costs;
🔲 the mortgage renewal date;
🔲 the property’s current capital value; and
🔲 whether the investment still supports the landlord’s wider objectives.
The answer will not always be to increase the rent or sell the property. Sometimes retaining a reliable tenant, reducing avoidable maintenance or preventing a void can be more valuable than pursuing the highest possible headline rent.
What about landlords looking to buy?
More properties for sale may create opportunities, particularly where a seller is motivated or a former rental property is being sold with improvement potential. But any prospective purchase should be tested against realistic assumptions.
That means allowing for the actual mortgage rate available, rather than the rate the landlord hopes may become available later. It also means budgeting for maintenance, compliance, letting costs and periods without rent.
A good property at the wrong price can still be a poor investment.

The Cope & Co. view
October’s evidence does not point to a Derbyshire property crash! Nor does it point to a booming market in which sellers can choose any asking price and wait for buyers to catch up. The three layers tell a consistent story:
Official completed-sale values remain resilient. Derby, Amber Valley and most Derbyshire districts are still higher than a year ago.
Properties are continuing to complete. The latest Land Registry counts are incomplete, but they demonstrate a functioning market across the county. More complete national transaction figures suggest activity is slightly softer, rather than collapsing.
The live market is more competitive. Buyers have more choice, fewer new enquiries are being generated and mortgage affordability is limiting what some households can pay.
Our conclusion is simple...
This is a selective market that rewards preparation.
For sellers, that means realistic pricing, strong presentation and a clear launch strategy.
For buyers, it means more choice, careful negotiation and getting financially organised.
For landlords, it means looking beyond headline rent growth and concentrating on the net performance of each property.
Whether you are considering selling a home in Derby, buying in Alfreton, or reviewing a rental portfolio across Derbyshire, the most useful advice will always be based on your particular property, local competition and personal objectives.
No inflated promises. No unnecessary jargon. Just practical property advice based on the best available evidence.
Cope & Co. is about relationships over transactions.


Data and methodology
Data periods used:
UK House Price Index – August 2026
HM Land Registry registered sales – June 2026
Rightmove – October 2026
Zoopla and RICS – September 2026
ONS private rents – September 2026
This report was prepared and published on 23 October 2026 using the latest information available at that date.
The official UK House Price Index covers completed transactions up to August 2026 and was published on 21 October. Local house-price estimates are provisional and can be revised as more information becomes available.
HM Land Registry local transaction counts cover June 2026. They represent sales registered so far and should not be treated as final totals or used on their own to calculate year-on-year transaction trends.
Rightmove’s figures relate to its October 2026 House Price Index, published on 19 October.
Zoopla’s market-activity figures cover the four weeks to 20 September and were published on 1 October.
The RICS survey covers September 2026. ONS private rental figures cover September 2026 and were published on 21 October.
Asking prices, agreed-sale data, completed-sale prices and registered transaction volumes measure different stages of the market and should not be treated as interchangeable.
Contains HM Land Registry data © Crown copyright and database right 2021. This data is licensed under the Open Government Licence v3.0.
This report provides general property-market information. It is not an individual property valuation, mortgage recommendation, tax advice or investment advice.